
How I Analyze Markets

Well trading isn’t about randomly pressing buy and sell button present on the screens. However the trading involves the analysation of market structure, liquidity and many more things. Today i’m gonna talk about How I Analyze Markets. How i decide my bias before starting my trading day
Analyzing The Market Direction
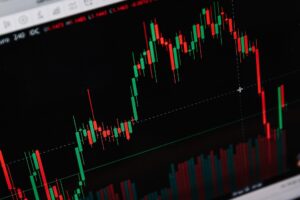
The first thing i do before planning my trading day or executing the trade. I try to decide the market direction and my bias for the day. Like where the price, structure or bias is moving forward. Although it includes bullish direction, bearish direction, consolidation and ranging. Although i decide my intraday bias according to the h1 time frame. Like if the h1 direction is bullish then i’ll look for the bullish setup only. Moreover, it say bearish then i’ll try to look for shorting opportunities. Meanwhile this isn’t enough to plan your trades. In addition you need to analyze the shorter time frame direction too if you are a intraday trader.
Identifying The Direction Of Shorter Time Frame
Let’s start with m5 time frame. Suppose that if the h1 time frame is under bearish pressure but m5 states the bullish momentum bcoz if price wants to approach higher time frame selling zones then it needs to establish the bullish change of character in m5 or m15 time frame. Meanwhile what i do in this scenario, i look for bullish setup in shorter time frame to catch the buying till the higher time frame selling range.
Marking Out The Important Zone

When you have analyzed the direction of ever time frame and decided your intraday bias for that particular day. Now here comes the question that at what level i’ll trade, how i’ll trade, how will i decide that this support zone or this resistance zone. Well in this section i’m gonna tell how i mark the zone, with aligning the higher time frame bias or direction.
Support Zone/ Demand Zone
If you have basic understanding of the any market then you would know what is support or demand zone and in case if you don’t i’ll try my best to explain what is support zones and how it works. However support zones in nothing but it tells you where the price took the rest. Usually it forms in the bullish structure which is known as higher high and higher low in trading terms or trading words. It states that the present high is above the last high and the current low is above the previous low. Meanwhile the support zone is represented by the red candle in bullish structure.
Resistance Zone/ Supply Zone
Although resistance or supply zones established in bearish structure. Well in bearish structure the price forms lower high and lower low to ensure the bearish continuation. In bearish structure support zones is known as the resistance zone. It tells you when buyers tried to take the control but sellers didn’t make it happen. Meanwhile this helps traders to identify that at what level the price can show the reversal. In addition where we can get opportunity to trade with bias. Moreover, the resistance levels are shown by the green candle in bearish structure.
How To Identify The Liquidity

Most of the beginner stuck at this topic what is liquidity and how to identify this. Every markets runs on the liquidity now what is liquidity? Liquidity is money in the trading terms. Now where the liquidity is present and how can we trade this. Well you can’t fully identify the where liquidity is present. Based on my understanding and experience most of time it is present below the support zone and above the resistance zone. However it is known as sl hunting now a days.
Session Analysis
Although there are 3 session runs in the forex market asian, london and nyc. Well i don’t trade the asian session so i’m not gonna say anything about that. I’ll talk about the london and nyc which i’m trading from the past 1.5 years. Well i’m not very use to of session bases analysis but here i’ll try to give you the overview as per my experience about the markets. London session known as continuation of asian bias and medium volatility and recommended for beginners traders. On the other nyc session known for its reversal and big moves with higher volatility, recommended for experienced traders.
Risk Management

This is the most important topic about the trading risk management. Without the risk management nobody can succeed in the markets. Now what is risk management and how to decide risk management. Risk management is deciding the fix risk for the particular trade. Whether it can be 2%, 3% of your trading capital or depending how much you are willing to lose in the one trade. Now risk management is to fix your stop loss and every trade should have the stop loss. There is term in the market which is “Protect Your Capital Like A Sword” bcoz capital is sword the market and stop loss is the shield which you need to survive in the battle of markets.
Conclusion

Market analysis is the mixture of liquidity, psychology and patience. Instead to predicting the every move, learn to stay with price action and the direction of market. Meanwhile no analysis and trader is perfect and right on the every time. But with experience, observation and understanding of the market everything’s starts getting right on the table.
Learn How To Start Trading As a Beginner post section to start trading from scratch